Where to find more space
When we were looking to buy somewhere to live, we visited a couple of houses for sale that looked great in the photos but turned out to be just slightly too small for our growing family. It took a bit of time to figure out which areas with houses vaguely within our price range might be a better fit.
This process might have been slightly easier had we been able to scour a map like the one below, which shows median house size by neighbourhood (or "lower layer super output area", for aficionados of ONS statistical boundaries), with darker dots showing areas where houses are bigger on average, and lighter ones representing those with smaller houses. Its creation has been made possible by the DCLG's recent decision to publish Energy Performance Certificate data.
Average floor space for houses, by neighbourhood
In general, rural areas have bigger houses than urban areas. You might expect suburbs to have houses that are somewhere in between, the trade-off for a longer commute being more space to live in. And in some of the UK's largest cities this is more-or-less true.
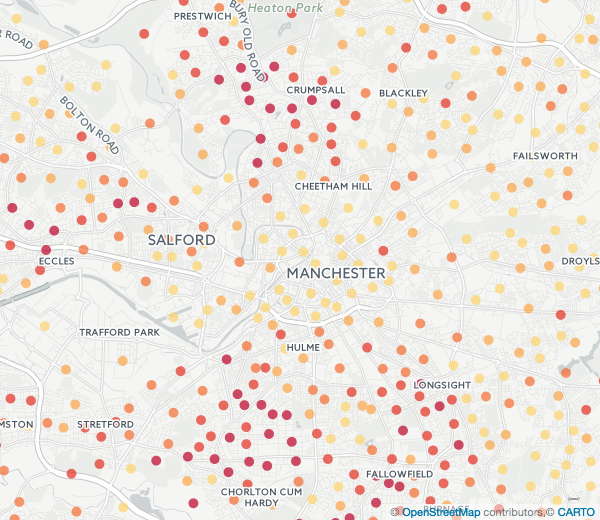
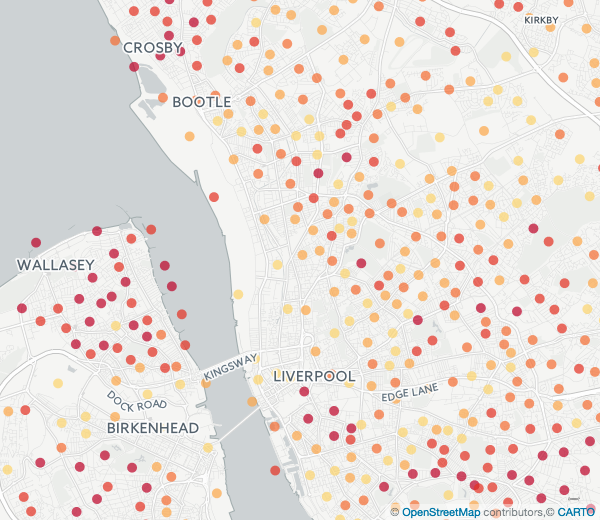
The cramped accommodation of central Manchester gives way to spacious housing in Salford and Eccles to the west, Crumpsall to the north, Chorlton cum Hardy and Fallowfield to the south - although there is little space premium to be gained from moving east. People living in central Liverpool meanwhile, except those lucky enough to enjoy palatial lodgings in the Georgian Quarter, just south of the city centre, could benefit by moving in pretty much any direction, but most espcially by crossing the Mersey and moving to Birkenhead or Wallasey.
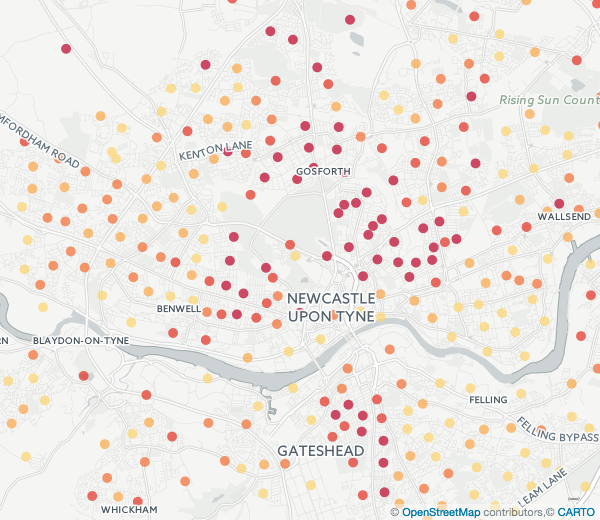
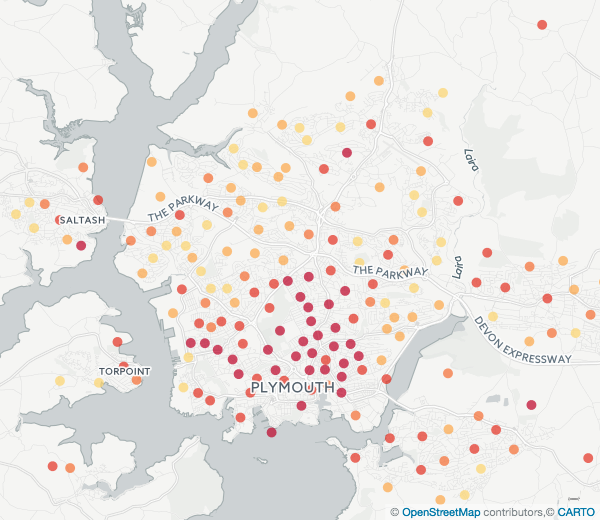
But this pattern is not repeated everywhere. In cities like Newcastle and Plymouth the grand housing of the historic town centres is encircled by smaller houses in the outskirts.
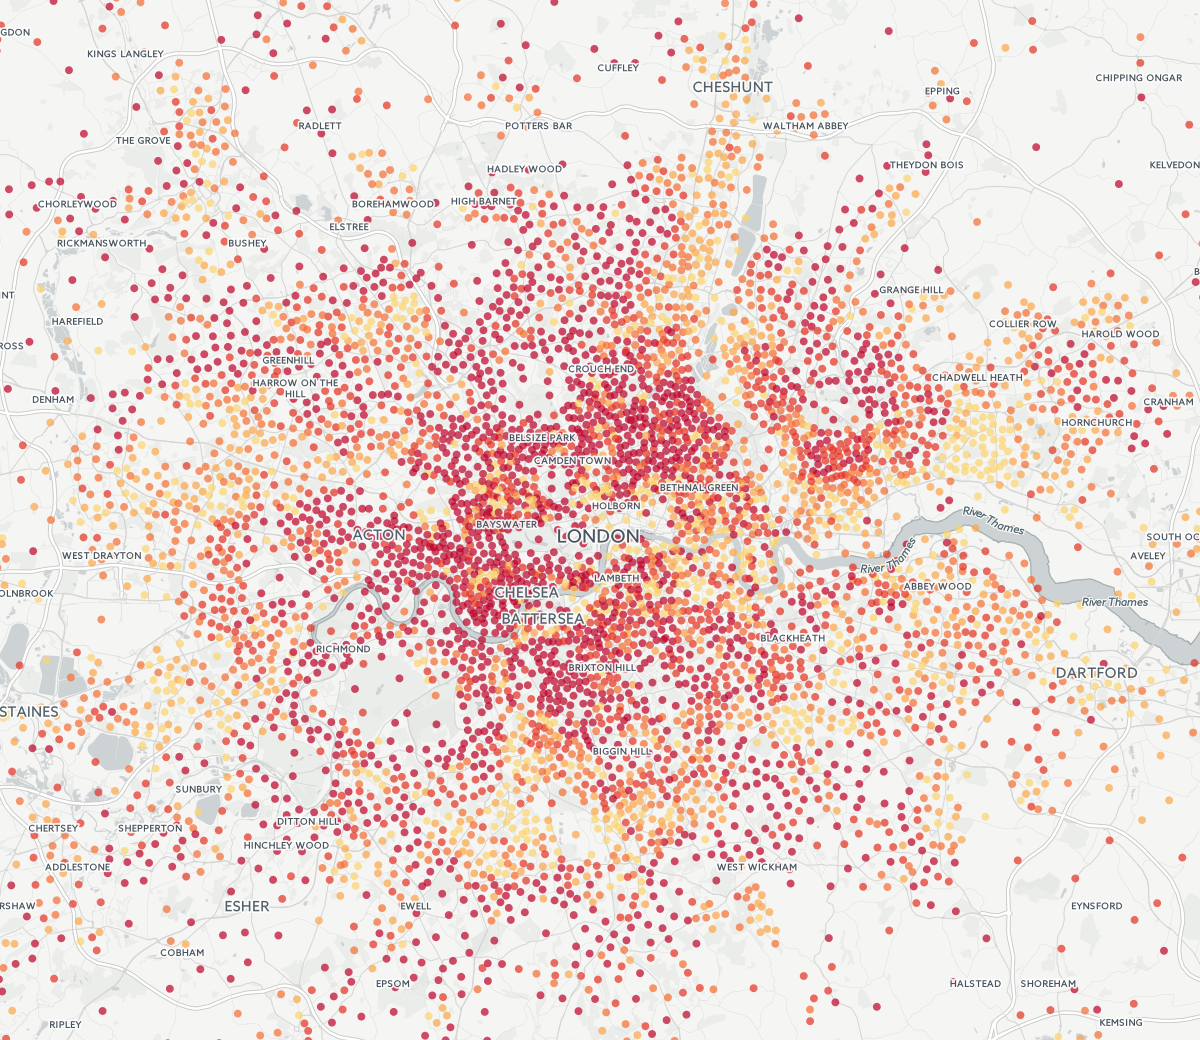
The picture is more complex still in London, where waves of affluence and deprivation have rippled outward from the Thames over the generations, with interference patterns enlarging houses in some areas but dampening architechtural ambitions in others.
Interesting though it may be to look in isolation at the size of houses, there is a reason we haven't all moved to Mayfair. The map below shows the most expensive neighbourhoods in darker shades.
Average cost of houses, by neighbourhood
The data displayed above is taken from the Land Registry's price paid dataset, and shows median house prices by neighbourhood for all transactions registered in 2015 and 2016.
One disadvantage of the map above is that it is hard to distinguish between neighbourhoods in London, where house prices are off the chart compared with much of the rest of the country. The colour scale on the map below has been recalibrated to make it easier to see these differences.
Average cost of houses by neighbourhood - London only
What may be of most use is a map combining the data on both the size of houses and their price. Looking for common addresses in the two previous datasets it is possible to find energy performance certificates for about 70% of all Land Registry transactions from 2015 and 2016. This linked dataset was used to make the map below, which gives a sense of the affordability of houses in each neighbourhood.
Average price per square foot of houses
And as above, here's another version recalibrated for Londoners.
Contact @edlowther on Twitter